CXL Introduction

What is CXL

CXL (Compute Express Link) is a new type of open interconnect standard designed for high-speed communication between processors and high-performance endpoint devices such as GPUs, FPGAs, or other accelerators.

When discussing CXL, it is indispensable to mention the hierarchical storage diagram in computer architecture. In the past, there was a significant gap between HDD disks and memory, but the emergence of SSDs and NVMe devices gradually bridged this gap. Traditional databases have become less sensitive to this difference because the bottleneck of the system has shifted to the CPU side. Therefore, in recent years, everyone has been focusing on column storage, vectorization, and other technologies to reduce memory usage. For many applications, although the latency of NVMe has met the requirements, throughput remains a significant bottleneck, and it cannot completely replace memory. Model training and vector data are very typical scenarios in this regard.
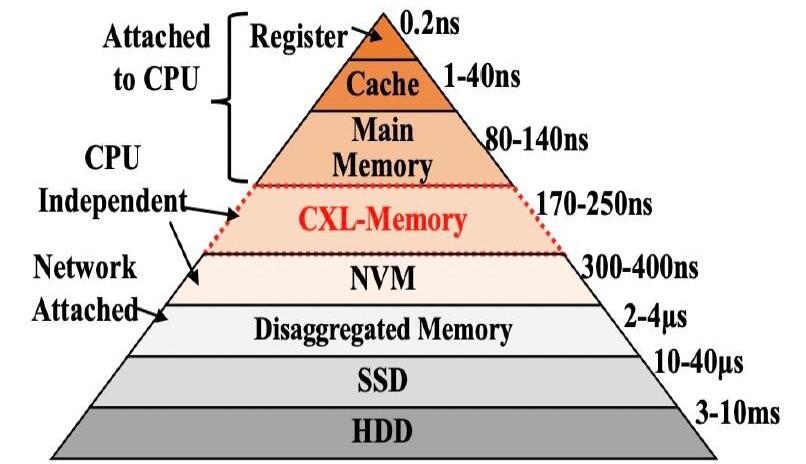
CXL effectively addresses this problem. By mounting the device on the PCIe bus, CXL establishes an interconnection between the device and the CPU, realizing the separation of storage and computation.
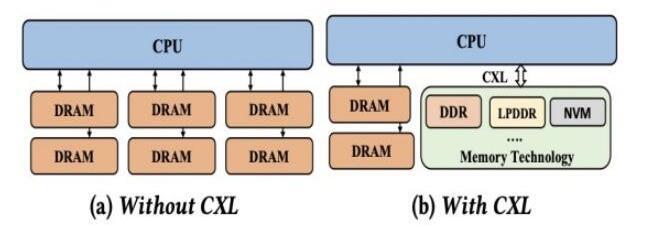
CXL Protocols

CXL comprises three different protocols - CXL.io, CXL.cache, and CXL.mem, each serving a different purpose.

  • CXL.io is built on the physical and link layers of the PCI Express (PCIe) infrastructure. It ensures backward compatibility with the PCIe ecosystem, thus leveraging the advantages of its wide deployment. When a CXL device is connected to a host, these operations are carried out through the CXL.io protocol. It handles input/output operations, and allows discovery, configuration, and basic management of devices.

  • CXL.cache provides cache coherency between the host processor cache hierarchy and the memory on CXL devices. This coherency allows the host and device to share resources, thereby reducing latency and improving data access rates. This is crucial for high-performance computing workloads such as big data processing and machine learning, which often require frequent access to large amounts of data.

  • CXL.mem allows the host processor to access a CXL device’s memory at high speed and with low latency. This mechanism allows the host to effectively utilize the device’s memory as a pool of resources, making it highly suitable for applications that require intensive data exchange.
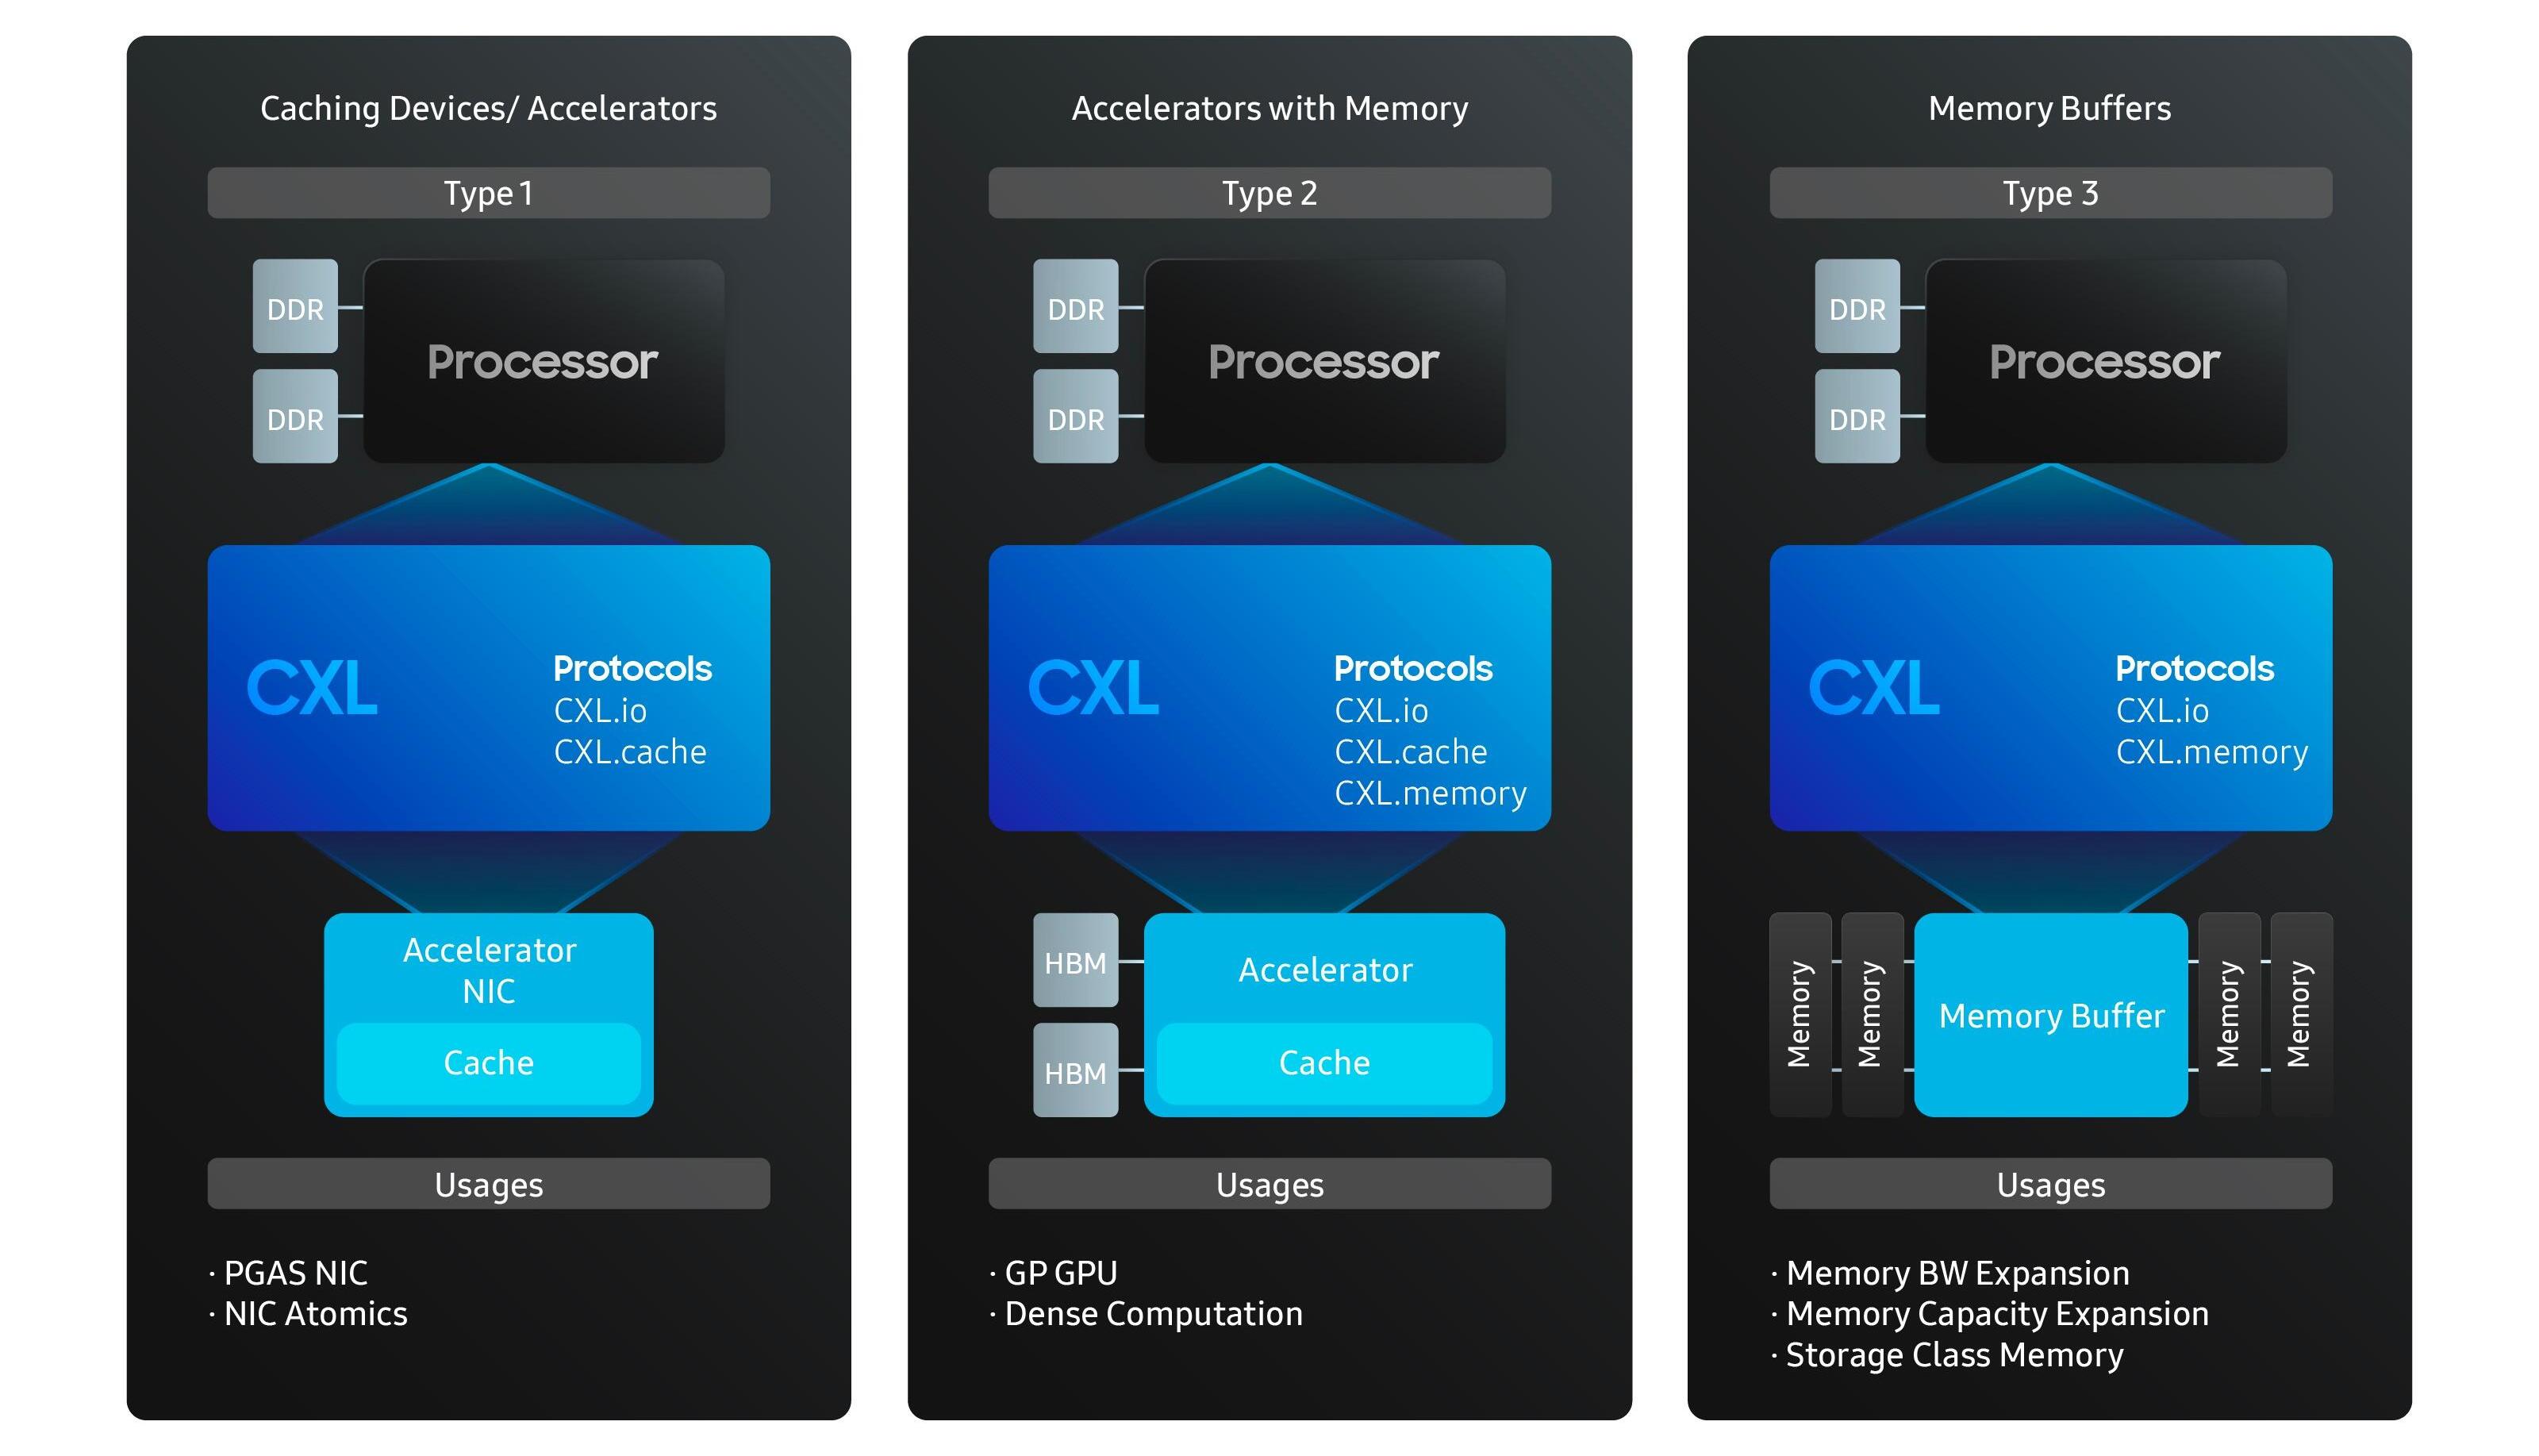
Specifically, CXL mainly defines three types of devices:

  • CXL Type 1 Device: This type of device includes accelerators and smart network cards. They access host memory via the CXL.cache protocol, maintaining a local cache that’s coherent with the host memory.

  • CXL Type 2 Device: This category includes devices such as GPUs and FPGAs, which have their own memory such as DDR and HBM. These devices can access the host memory directly like Type 1 devices. Additionally, they can use the CXL.mem protocol to allow the host to access their local address space.

  • CXL Type 3 Device: These are memory expansion devices that allow the host to access their memory buffer consistently via CXL.mem transactions. Type 3 CXL devices can be used to increase memory capacity and bandwidth.

Maximizing CXL Efficiency

To fully utilize CXL memory, several crucial factors must be taken into account:

  1. Consider the memory hierarchy fully and use RAM or even Cache as the buffer for CXL.

  2. Push down computations as much as possible to reduce the amount of data that the bus needs to handle.

  3. Take the latency of CXL fully into account and design pipelines or use prefetching techniques to reduce the impact of latency on throughput.

  4. Fully exploit the advantages of large memory to minimize the performance impact brought by data exchange in distributed systems.
References

  1. https://zhuanlan.zhihu.com/p/646858357
  2. https://jia.je/hardware/2022/11/20/cxl-notes/

MQTT Publish/Subscribe

Publish

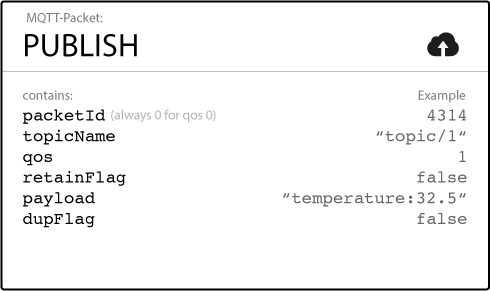
Each message must include a topic, through which the broker delivers the message to clients interested in that topic. The specific content of the message is passed in binary form. MQTT is agnostic to the content of the message, and the client can send data in any format, such as binary data, text data, XML data, or JSON data, etc.

Format

The topic is a hierarchical structure composed of strings separated by slashes, for example, “home/bedroom/temperature”.

Quality of Service

Quality of Service determines the guarantee level for message delivery to the target. Quality of Service is divided into three levels: 0, 1, 2. 0 means the message is delivered at most once, and if it fails, no retries will be made. 1 means the message is delivered at least once, and if the recipient does not explicitly receive it (returns acked), it will continue to retry sending. 2 means the message is delivered exactly once.

Retain Flag

The retain flag determines whether the message is retained as the latest message for this topic. When a new client subscribes to this topic, it will receive the latest retained message for this topic. For each topic, there can be at most one retained message, but there may also be none.

Message Payload

The message payload is the specific content of the message. MQTT is unaware of the content of the message, so users can send any message.

Duplicate Field

When the quality of service of the message is greater than 0, this field is set when the message is retried.

QoS Levels

MQTT supports three Quality of Service (QoS) levels. They are defined as follows:

  1. QoS 0: At most once delivery
    This is the lowest level of service. A message is delivered at most once, and it might not be delivered at all if network disruptions occur. The message is sent from the sender (publisher) to the receiver (subscriber) without any confirmation message. There is no retransmission of the message.

  2. QoS 1: At least once delivery
    In this level of service, a message is assured to be delivered at least once to the receiver. After the sender sends the message, it stores a copy of the message until it receives a PUBACK message from the receiver. If the sender does not receive a PUBACK message within a certain period, it will resend the message.

  3. QoS 2: Exactly once delivery
    This is the highest level of service, where a message is assured to be delivered exactly once. This is achieved using a four-step handshake process:

    • The sender sends the message and keeps a copy of it. The message is marked as “unconfirmed”.
    • The receiver responds with a PUBREC message to acknowledge receipt of the message.
    • The sender receives the PUBREC message, removes the “unconfirmed” mark from the stored message, and responds with a PUBREL message.
    • Finally, the receiver responds with a PUBCOMP message to confirm that it has processed the PUBREL message. The sender can now safely delete the message from its storage.

Each level of service has different trade-offs in terms of network traffic, latency, and complexity. You should choose the appropriate QoS level based on the specific requirements of your application.

Subscribe

If no client subscribes to a topic, any messages published to that topic won’t be received by any client. Clients need to send a subscription request to the broker in order to subscribe to the corresponding topic.

Format

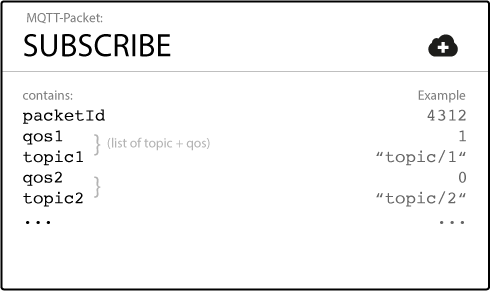
Packet Identifier

This is a unique identifier for each SUBSCRIBE message. Both the broker and client maintain their own Packet Identifier for each ongoing conversation. The identifier doesn’t need to be globally unique, but it does need to be unique within the scope of the client-broker communication session.

Subscription List

A single SUBSCRIBE message can request multiple topic subscriptions. Each subscription request needs to include the topic to be subscribed to and the desired Quality of Service (QoS) level. The topic string in the SUBSCRIBE packet can include wildcard characters. If the same topic is subscribed to with different QoS levels (i.e., overlapping subscriptions), the broker will deliver messages to the client at the highest QoS level that has been granted.

Subscription Acknowledgement

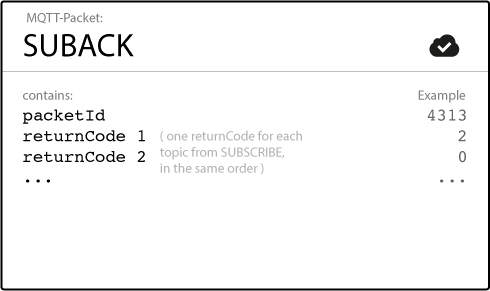
After the client requests to subscribe to a topic, the broker will respond with a SUBACK.

Format

The message includes a Packet Identifier that matches the one in the subscription request, as well as a set of return codes, as shown below:

Packet Identifier

This Packet Identifier should match the one in the corresponding subscription request.

Return Codes

The return codes correspond to the QoS-topic list in the subscription request, confirming the result of each subscription one-to-one. If successful, the corresponding Quality of Service (0/1/2) will be returned. If the subscription fails, the return code will be 0x80 (128 in decimal).

After the client initiates a subscription and receives a successful subscription acknowledgement, this client will be able to normally receive any subsequent messages sent to that topic.

Unsubscribe

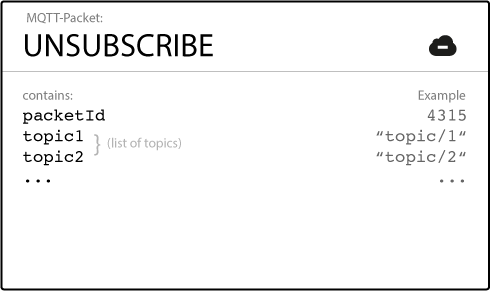
The UNSUBSCRIBE packet is as follows, mainly containing a Packet Identifier and a list of topics to be unsubscribed:

Unsubscribe Acknowledgement

The return for an UNSUBSCRIBE request is an UNSUBACK message that only contains a Packet Identifier matching the one in the UNSUBSCRIBE request. An UNSUBACK is sent regardless of whether the topic was previously subscribed to or not.

Conclusion

MQTT message delivery is implemented through subscribing to specific topics, then publishing messages to those topics.

There’s no need to create and maintain topics before publishing, nor worry about whether there are clients subscribing to specific topics.

The Publish/Subscribe model decouples publishers and subscribers, making it easier to arrange various business scenarios, such as implementing grouping, broadcasting, etc.

However, the Publish/Subscribe model also brings a challenge: if the publisher wishes to be aware of the subscriber’s receipt of a message, this can only be accomplished at the application layer. For example, after a subscriber receives a message, it can publish a confirmation message to the publisher through another topic.

eBPF Introduction

What is eBPF

eBPF (extended Berkeley Packet Filter) is a virtual machine that runs within the kernel. It allows the extension of kernel functionality in a safe and efficient manner without modifying kernel code or loading additional kernel modules. It is capable of running BPF programs, into which users can inject as needed for execution within the kernel. These programs adhere to a specific instruction set provided by eBPF, must follow certain rules, and only safe programs are allowed to run.

The use of eBPF is on the rise, with an increasing number of eBPF programs being applied. For instance, replacing iptables rules with eBPF allows packets sent from applications to be directly forwarded to the socket of the recipient, effectively handling data packets by shortening the data path and accelerating the data plane.

eBPF Core Principles

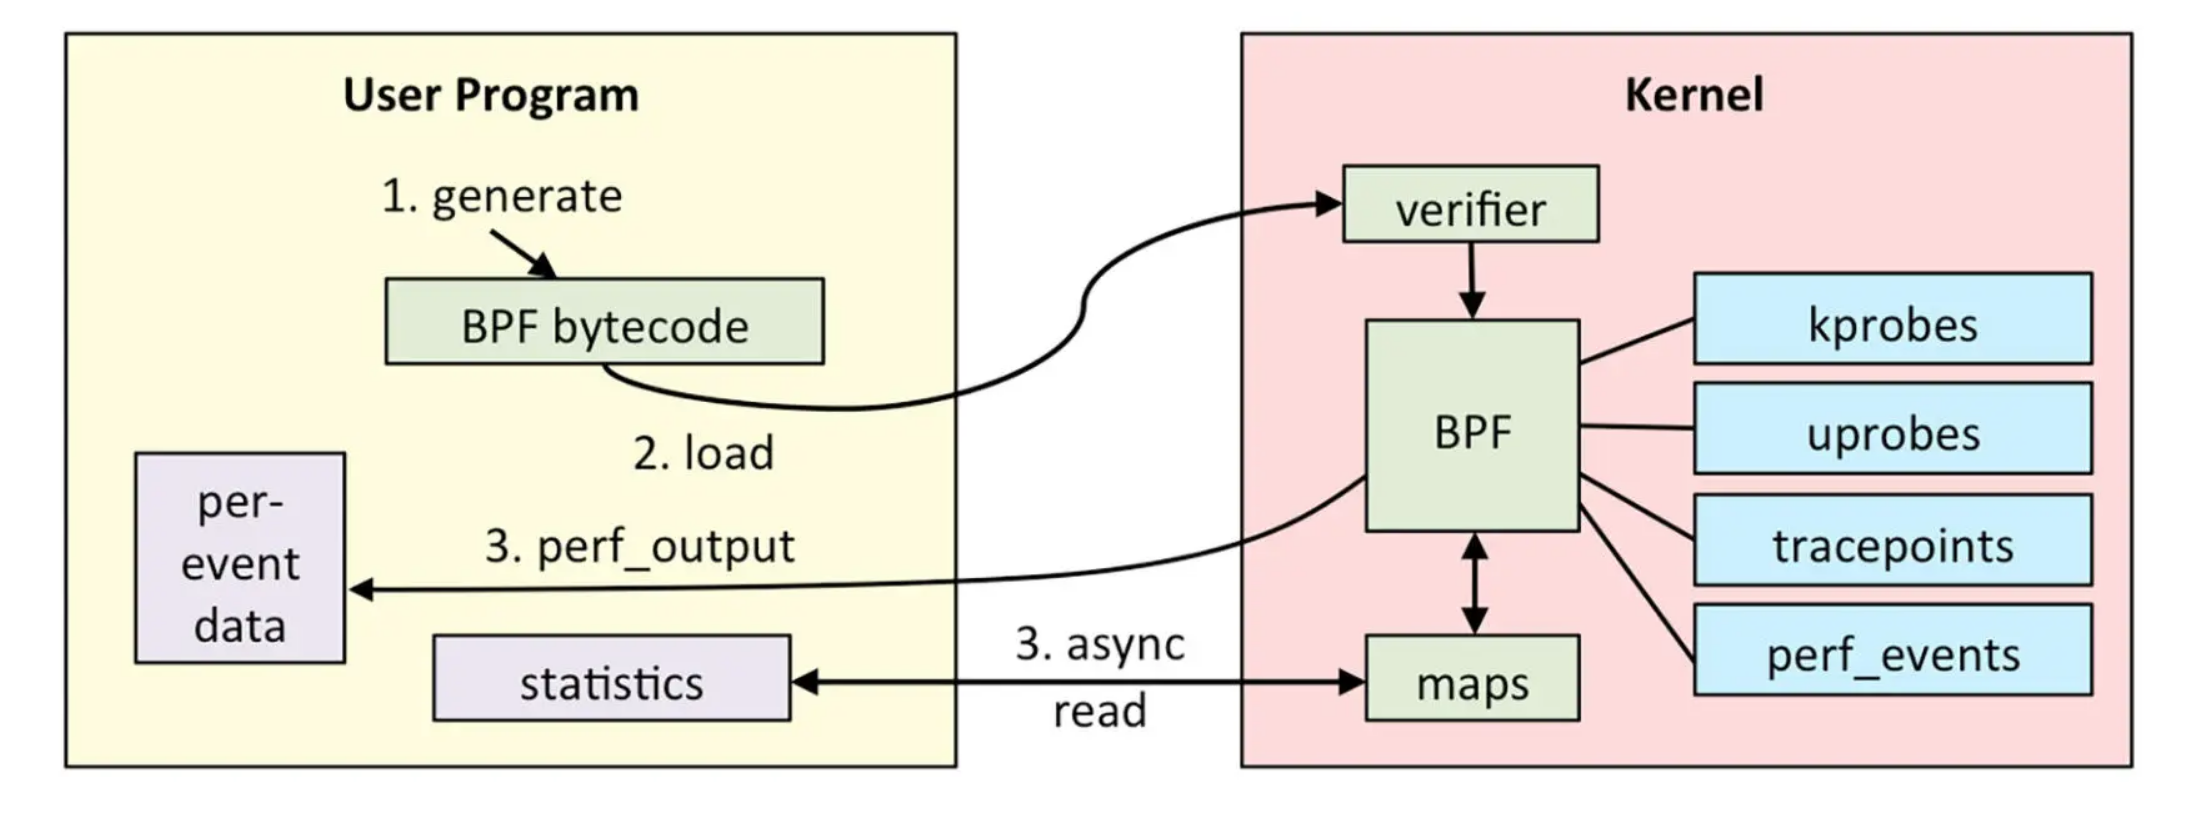
The architecture diagram of eBPF is as follows:

eBPF is divided into two parts: programs running in user space and programs running in kernel space. The user space program is responsible for loading the BPF bytecode into the eBPF virtual machine in the kernel space, and reading various event information and statistical information returned by the kernel when needed. The BPF virtual machine in the kernel is responsible for executing specific events in the kernel. If data transmission is required, the execution results are sent to the user space through the BPF map or perf-events in the perf buffer. The whole process is as follows:

  1. The written BPF program will be compiled into BPF bytecode by tools such as Clang, LLVM, etc. (because the BPF program is not a regular ELF program, but bytecode running in a virtual machine). The eBPF program will also include configured event sources, which are actually some hooks that need to be mounted.

  2. The loader will load it into the kernel via the eBPF system call before the program runs. At this time, the verifier will verify the safety of the bytecode, such as verifying that the number of loops must end within a limited time. Once the verification is passed and the mounted event occurs, the logic of the bytecode will be executed in the eBPF virtual machine.

  3. (Optional) Output each event individually, or return statistical data and call stack data through the BPF map, and transmit it to the user space.

eBPF supports a number of major probes, such as static tracing of socket、tracepoint、USDT, and dynamic tracing of kprobe, uprobe, etc.

Dynamic Tracing

eBPF provides:

  • kprobe/kretprobe for the kernel, where k = kernel
  • uprobe/uretprobe for applications, where u = userland

These are used to detect information at the entry and return (ret) points of functions.

kprobe/kretprobe can probe most kernel functions, but for security reasons, some kernel functions do not allow probe installation, which could lead to failure in tracing.

uprobe/uretprobe are mechanisms to implement dynamic tracing of userland programs. Similar to kprobe/kretprobe, the difference is that the traced functions are in user programs.

Dynamic tracing technology relies on the symbol table of the kernel and applications. For those inline or static functions, probes cannot be installed directly, and they need to be implemented through offset. The nm or strings command can be used to view the symbol table of the application.

The principle of dynamic tracing technology is similar to GDB. When a probe is installed on a certain code segment, the kernel will copy the target position instruction and replace it with an int3 interrupt. The execution flow jumps to the user-specified probe handler, then executes the backed-up instruction. If a ret probe is also specified at this time, it will be executed. Finally, it jumps back to the original instruction sequence.

Next, let’s see how to perform dynamic tracing. First, write a main.go test code:

1
2
3
4
5
6
7
8
9
package main

func main() {
println(sum(3, 3))
}

func sum(a, b int) int {
return a + b
}

Next, disable inline optimization and compile the code by executing the go build -gcflags="-l" ./main.go command. If inline optimization is enabled, it is likely that the Go compiler will eliminate function calls during compilation, so eBPF will not be able to find the probe corresponding to the function.

The next step is to write a bpftrace script main.pt:

1
2
3
4
5
6
7
8
BEGIN{
printf("Hello!\n");
}
uprobe:./main:main.sum {printf("a: %d b: %d\n", reg("ax"), reg("bx"))}
uretprobe:./main:main.sum {printf("retval: %d\n", retval)}
END{
printf("Bye!\n");
}

Finally, execute bpftrace to monitor this function call, run the bpftrace main.pt command, then press Ctl+C to exit, and get the following output:

1
2
3
4
Hello!
a: 3 b: 3
retval: 6
^CBye!

Static Tracing

“Static” means that the probe’s position and name are hardcoded in the code and are determined at compile time. The implementation principle of static tracing is similar to callbacks: it is executed when activated, and not executed when deactivated, making it more performant than dynamic tracing. Among them:

  • tracepoint is in the kernel
  • USDT (Userland Statically Defined Tracing) is in the application

Static tracing has already included probe parameter information in the kernel and applications, and you can directly access function parameters through args->parameter_name. You can check the parameter information of tracepoint through bpftrace -lv, for example:

1
2
3
4
5
6
7
8
bpftrace -lv tracepoint:syscalls:sys_enter_openat
# Output:
# tracepoint:syscalls:sys_enter_openat
# int __syscall_nr;
# int dfd;
# const char * filename;
# int flags;
# umode_t mode;

Static tracing accesses the filename parameter of sys_enter_openat through args->filename:

1
2
3
4
5
6
7
8
9
bpftrace -e 'tracepoint:syscalls:sys_enter_openat { printf("%s %s\n", comm, str(args->filename)); }'
# Output:
# Attaching 1 probe...
# uwsgi /proc/self/stat
# uwsgi /proc/self/fd
# uwsgi /proc/self/statm
# uwsgi /proc/loadavg
# uwsgi /proc/self/io
# ...

Here, comm represents the name of the parent process.