eBPF Introduction
What is eBPF
eBPF (extended Berkeley Packet Filter) is a virtual machine that runs within the kernel. It allows the extension of kernel functionality in a safe and efficient manner without modifying kernel code or loading additional kernel modules. It is capable of running BPF programs, into which users can inject as needed for execution within the kernel. These programs adhere to a specific instruction set provided by eBPF, must follow certain rules, and only safe programs are allowed to run.
The use of eBPF is on the rise, with an increasing number of eBPF programs being applied. For instance, replacing iptables rules with eBPF allows packets sent from applications to be directly forwarded to the socket of the recipient, effectively handling data packets by shortening the data path and accelerating the data plane.
eBPF Core Principles
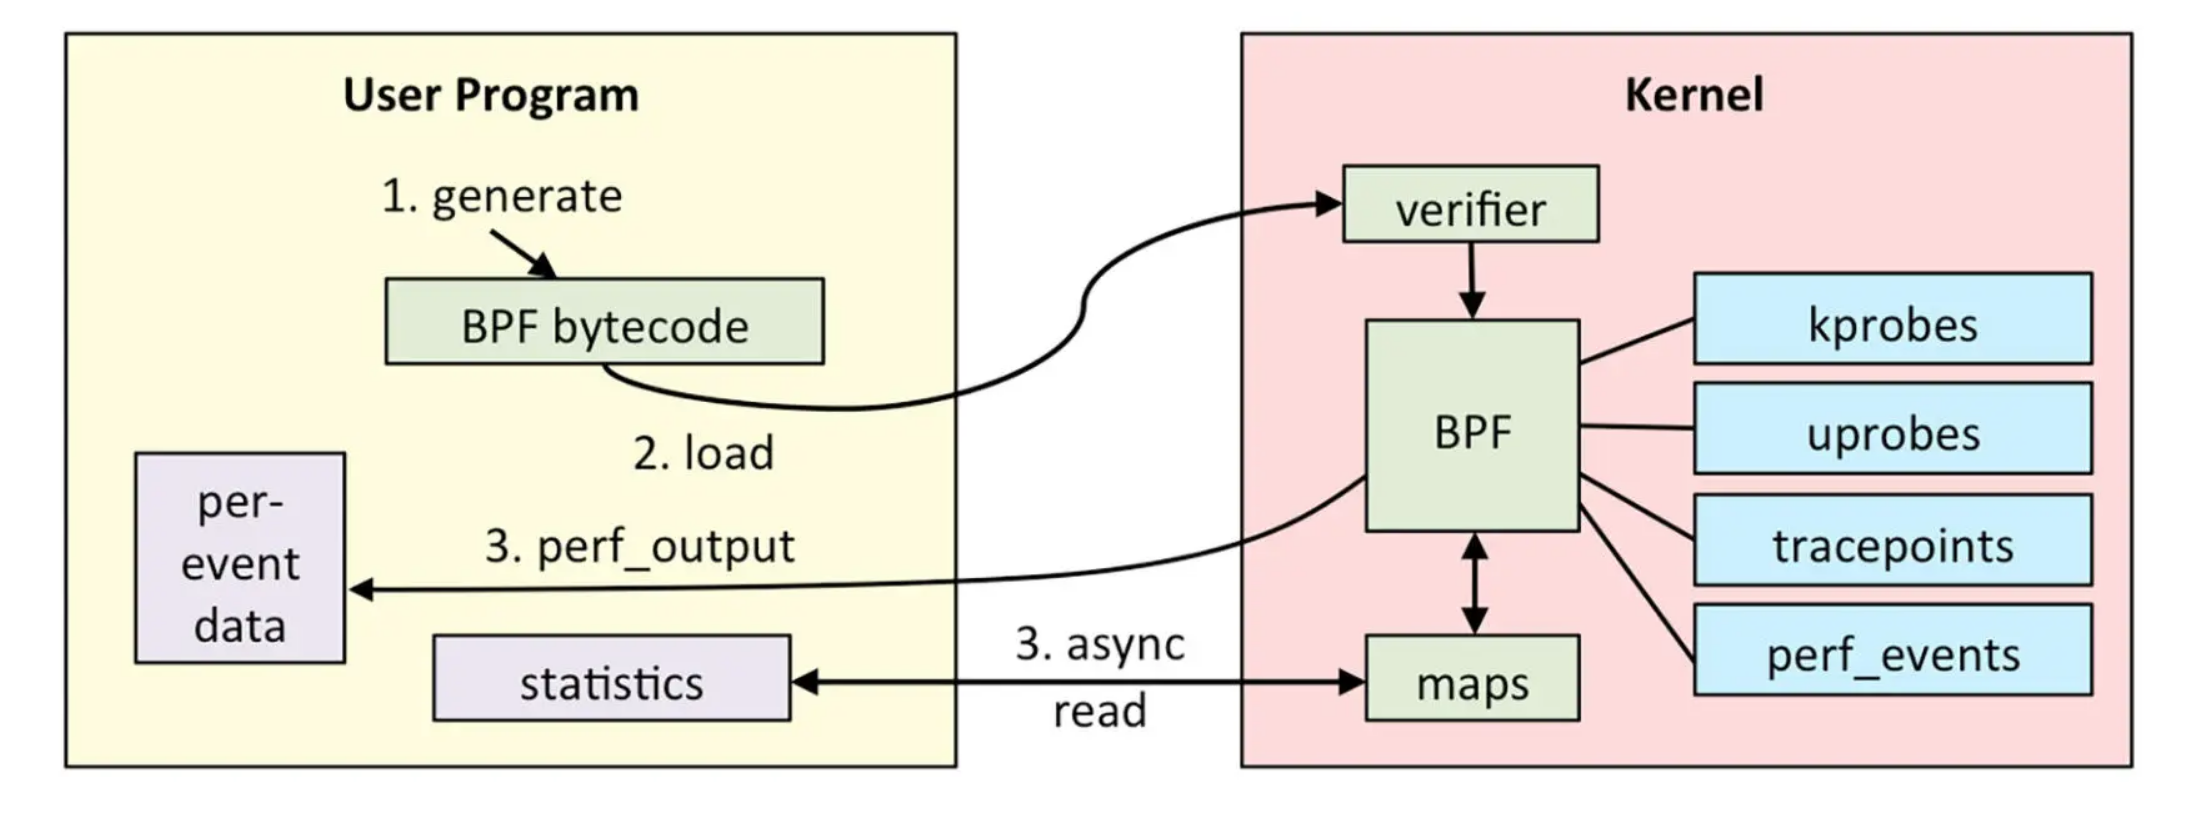
The architecture diagram of eBPF is as follows:

eBPF is divided into two parts: programs running in user space and programs running in kernel space. The user space program is responsible for loading the BPF bytecode into the eBPF virtual machine in the kernel space, and reading various event information and statistical information returned by the kernel when needed. The BPF virtual machine in the kernel is responsible for executing specific events in the kernel. If data transmission is required, the execution results are sent to the user space through the BPF map or perf-events in the perf buffer. The whole process is as follows:
The written BPF program will be compiled into BPF bytecode by tools such as Clang, LLVM, etc. (because the BPF program is not a regular ELF program, but bytecode running in a virtual machine). The eBPF program will also include configured event sources, which are actually some hooks that need to be mounted.
The loader will load it into the kernel via the eBPF system call before the program runs. At this time, the verifier will verify the safety of the bytecode, such as verifying that the number of loops must end within a limited time. Once the verification is passed and the mounted event occurs, the logic of the bytecode will be executed in the eBPF virtual machine.
(Optional) Output each event individually, or return statistical data and call stack data through the BPF map, and transmit it to the user space.
eBPF supports a number of major probes, such as static tracing of socket、tracepoint、USDT, and dynamic tracing of kprobe, uprobe, etc.
Dynamic Tracing
eBPF provides:
- kprobe/kretprobe for the kernel, where k = kernel
- uprobe/uretprobe for applications, where u = userland
These are used to detect information at the entry and return (ret) points of functions.
kprobe/kretprobe can probe most kernel functions, but for security reasons, some kernel functions do not allow probe installation, which could lead to failure in tracing.
uprobe/uretprobe are mechanisms to implement dynamic tracing of userland programs. Similar to kprobe/kretprobe, the difference is that the traced functions are in user programs.
Dynamic tracing technology relies on the symbol table of the kernel and applications. For those inline or static functions, probes cannot be installed directly, and they need to be implemented through offset. The nm or strings command can be used to view the symbol table of the application.
The principle of dynamic tracing technology is similar to GDB. When a probe is installed on a certain code segment, the kernel will copy the target position instruction and replace it with an int3 interrupt. The execution flow jumps to the user-specified probe handler, then executes the backed-up instruction. If a ret probe is also specified at this time, it will be executed. Finally, it jumps back to the original instruction sequence.
Next, let’s see how to perform dynamic tracing. First, write a main.go test code:
1 | package main |
Next, disable inline optimization and compile the code by executing the go build -gcflags="-l" ./main.go command. If inline optimization is enabled, it is likely that the Go compiler will eliminate function calls during compilation, so eBPF will not be able to find the probe corresponding to the function.
The next step is to write a bpftrace script main.pt:
1 | BEGIN{ |
Finally, execute bpftrace to monitor this function call, run the bpftrace main.pt command, then press Ctl+C to exit, and get the following output:
1 | Hello! |
Static Tracing
“Static” means that the probe’s position and name are hardcoded in the code and are determined at compile time. The implementation principle of static tracing is similar to callbacks: it is executed when activated, and not executed when deactivated, making it more performant than dynamic tracing. Among them:
- tracepoint is in the kernel
- USDT (Userland Statically Defined Tracing) is in the application
Static tracing has already included probe parameter information in the kernel and applications, and you can directly access function parameters through args->parameter_name. You can check the parameter information of tracepoint through bpftrace -lv, for example:
1 | bpftrace -lv tracepoint:syscalls:sys_enter_openat |
Static tracing accesses the filename parameter of sys_enter_openat through args->filename:
1 | bpftrace -e 'tracepoint:syscalls:sys_enter_openat { printf("%s %s\n", comm, str(args->filename)); }' |
Here, comm represents the name of the parent process.
eBPF Introduction